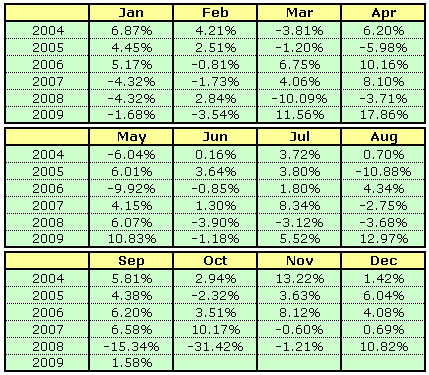
If we try to see the pattern of Jakarta Composite Index (JCI) return from 2004 – September 2009 and divide the return on monthly basis, we could come to this chart:

If we see the chart above, it’s difficult to see the true pattern. Maybe we should expand the time horizon back to 90’s. But at least we’ve got this:

The table tries to detail the monthly return. By using simple probability calculation, we come to this result:

And the hidden story is: for the last 6 years, JCI has at least three months which give the positive return. There are: July, September, and December. Each month has probability of 83%, 83%, and 100% respectively of positive monthly return.
The highest average return lies on April, November, December, and July. And it seems in December JCI has a nice offering: good return and strong probability 🙂